By the Numbers: What Boston's Crime Statistics Reveal About Public Safety in 2026
New data shows violent crime down 12% across the city, but property theft spikes in Downtown and the Seaport raise questions about resource allocation.
New data shows violent crime down 12% across the city, but property theft spikes in Downtown and the Seaport raise questions about resource allocation.
Boston's crime landscape in the first half of 2026 tells a story of marked improvement in some neighborhoods and persistent challenges in others, according to newly released statistics from the Boston Police Department and the city's Public Safety Analytics division.
Overall violent crime—including assault, robbery, and homicide—declined 12% compared to the same period last year, with 147 incidents reported through June versus 167 in 2025. Homicides specifically fell to just 8 cases year-to-date, down from 14 in the first six months of 2025. The decrease marks the second consecutive year of decline and comes as the department maintains a force of 2,100 officers across 11 districts.
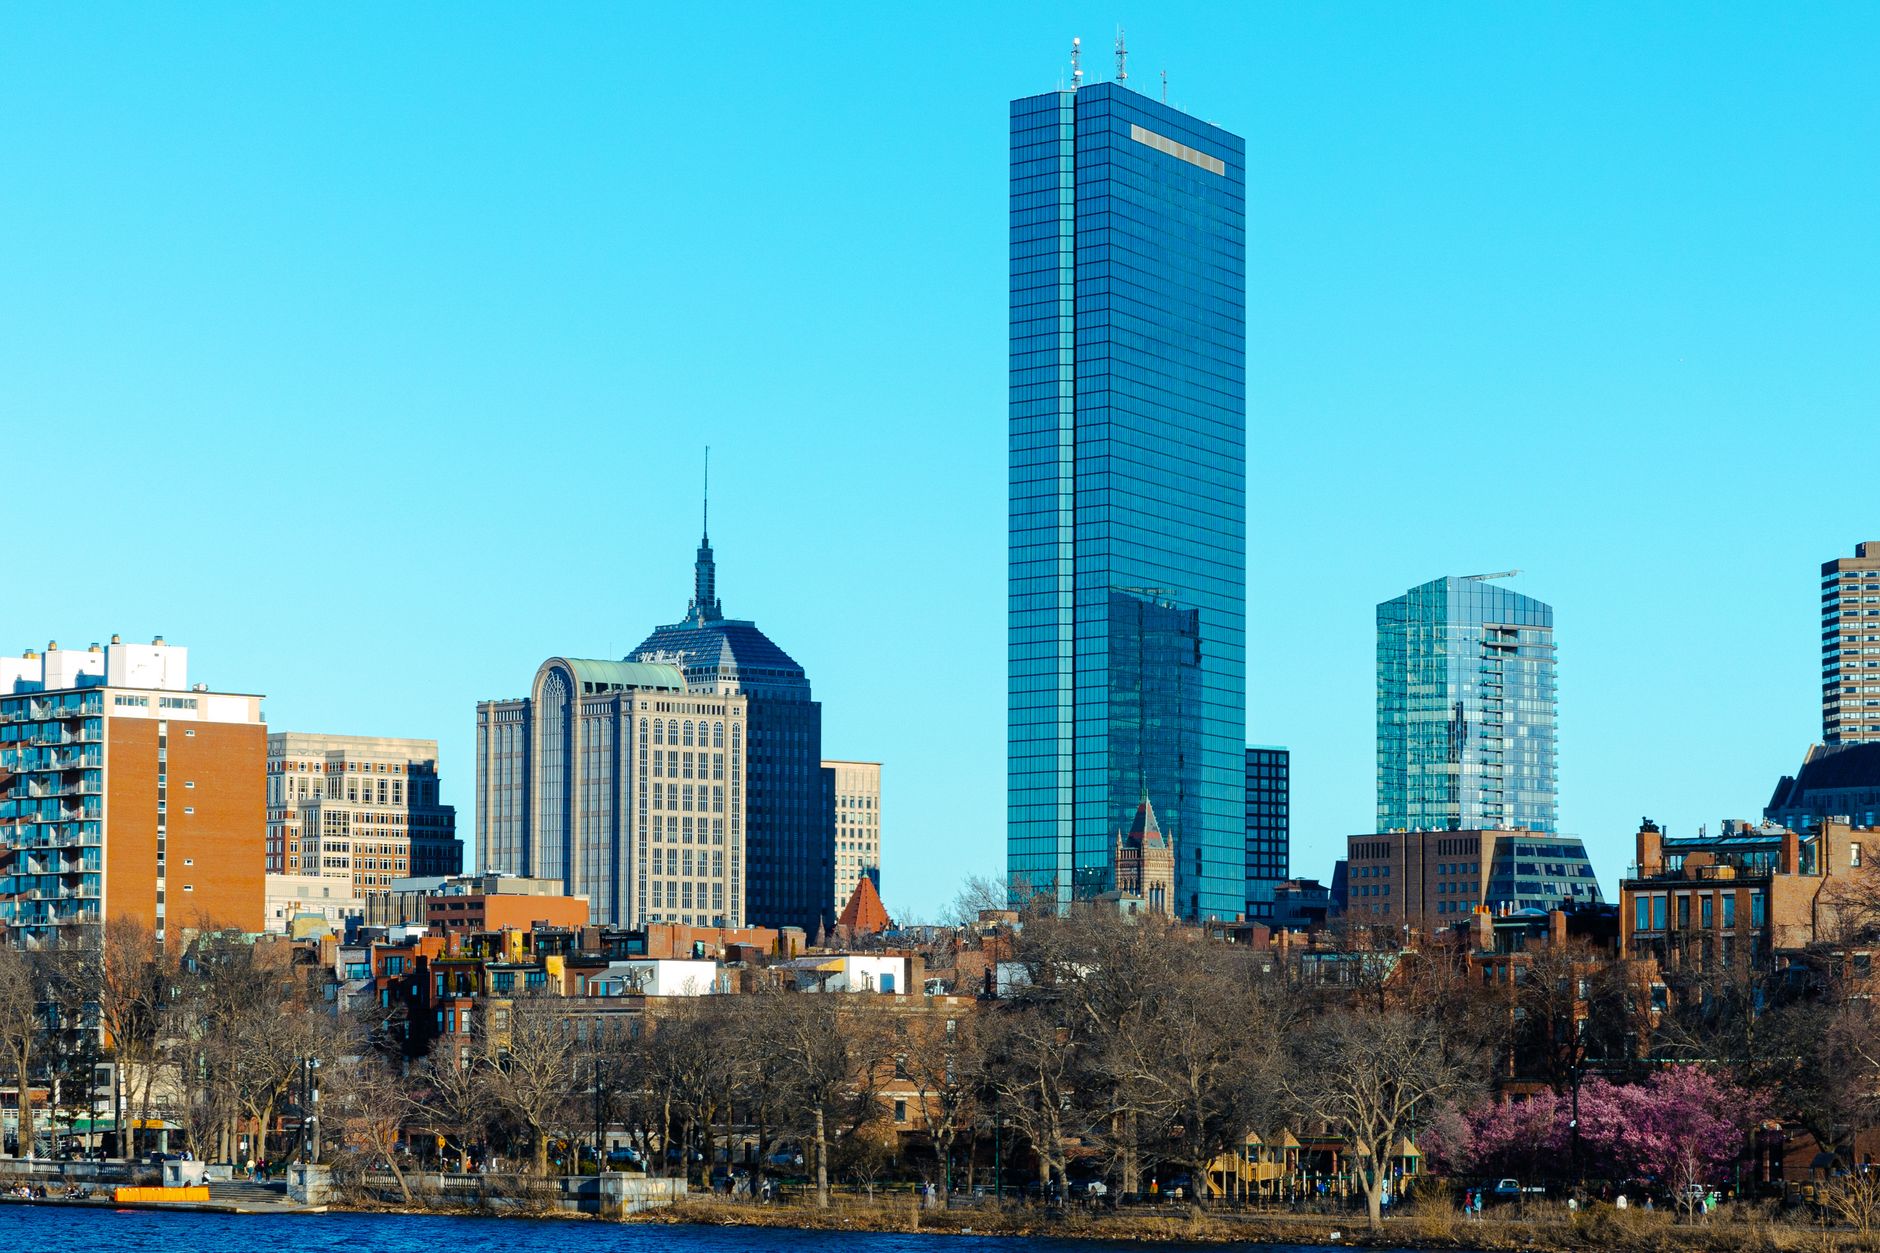
Yet the data reveals stark geographic disparities. Roxbury and Dorchester continue to account for 34% of all violent crimes despite comprising roughly 18% of the city's population. In contrast, Back Bay and Beacon Hill reported just 12 incidents combined—a rate roughly one-tenth that of neighborhoods further south and west.
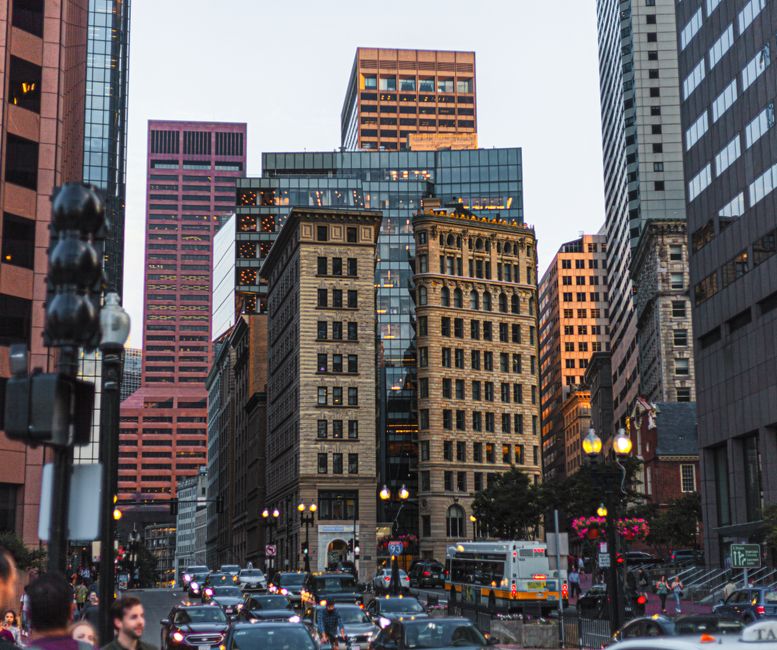
Property crimes tell a different story. Retail theft in the Downtown crossing district jumped 28% to 892 reported incidents, while car break-ins along the Seaport's growing residential corridor spiked 41% year-over-year. The financial impact is substantial: the average cost of a break-in repair runs between $800 and $2,200, according to city data, with business owners estimating annual losses exceeding $14 million.
Emergency response times have improved marginally. The average response to Priority 1 calls—life-threatening situations—now stands at 4 minutes 23 seconds, down from 4 minutes 51 seconds in 2025. Priority 2 calls average 7 minutes 14 seconds. Yet in neighborhoods like Mattapan, response times stretch to an average of 6 minutes 45 seconds for Priority 1 calls, a disparity city officials attribute to traffic patterns and station placement.
The Boston Fire Department, which handles medical emergencies alongside the EMS, responded to 127,400 calls in the first half of 2026—a 7% increase from 2025. Opioid-related overdose responses, specifically, rose to 2,340 incidents, continuing an upward trend that has prompted the city to expand Narcan distribution and mobile crisis units.
City Councilor Michelle Wu has called for a deeper examination of the data disparities. "The numbers show us where we're succeeding and where we need to do better," she said at a June public safety hearing. "Investment must follow evidence."
The Police Department's next comprehensive report is due in December 2026.
This article was compiled by AI from the sources linked above and screened before publishing. See our editorial standards.
How does this story make you feel?
Spread the word
About this article
Published by The Daily Boston
Daily brief
Free, in your inbox before 7am. Weekdays.
More in News