By the Numbers: What Boston's Crime Data Reveals About Safety in 2026
New statistics paint a complex picture of public safety across the city, with some neighborhoods showing improvement while emergency response times remain a critical concern.
New statistics paint a complex picture of public safety across the city, with some neighborhoods showing improvement while emergency response times remain a critical concern.
Boston's crime landscape in the first half of 2026 tells a story that defies simple narrative, according to newly released data from the Boston Police Department and city emergency services. The numbers reveal patterns that challenge assumptions and highlight where resources are—and aren't—being deployed effectively.
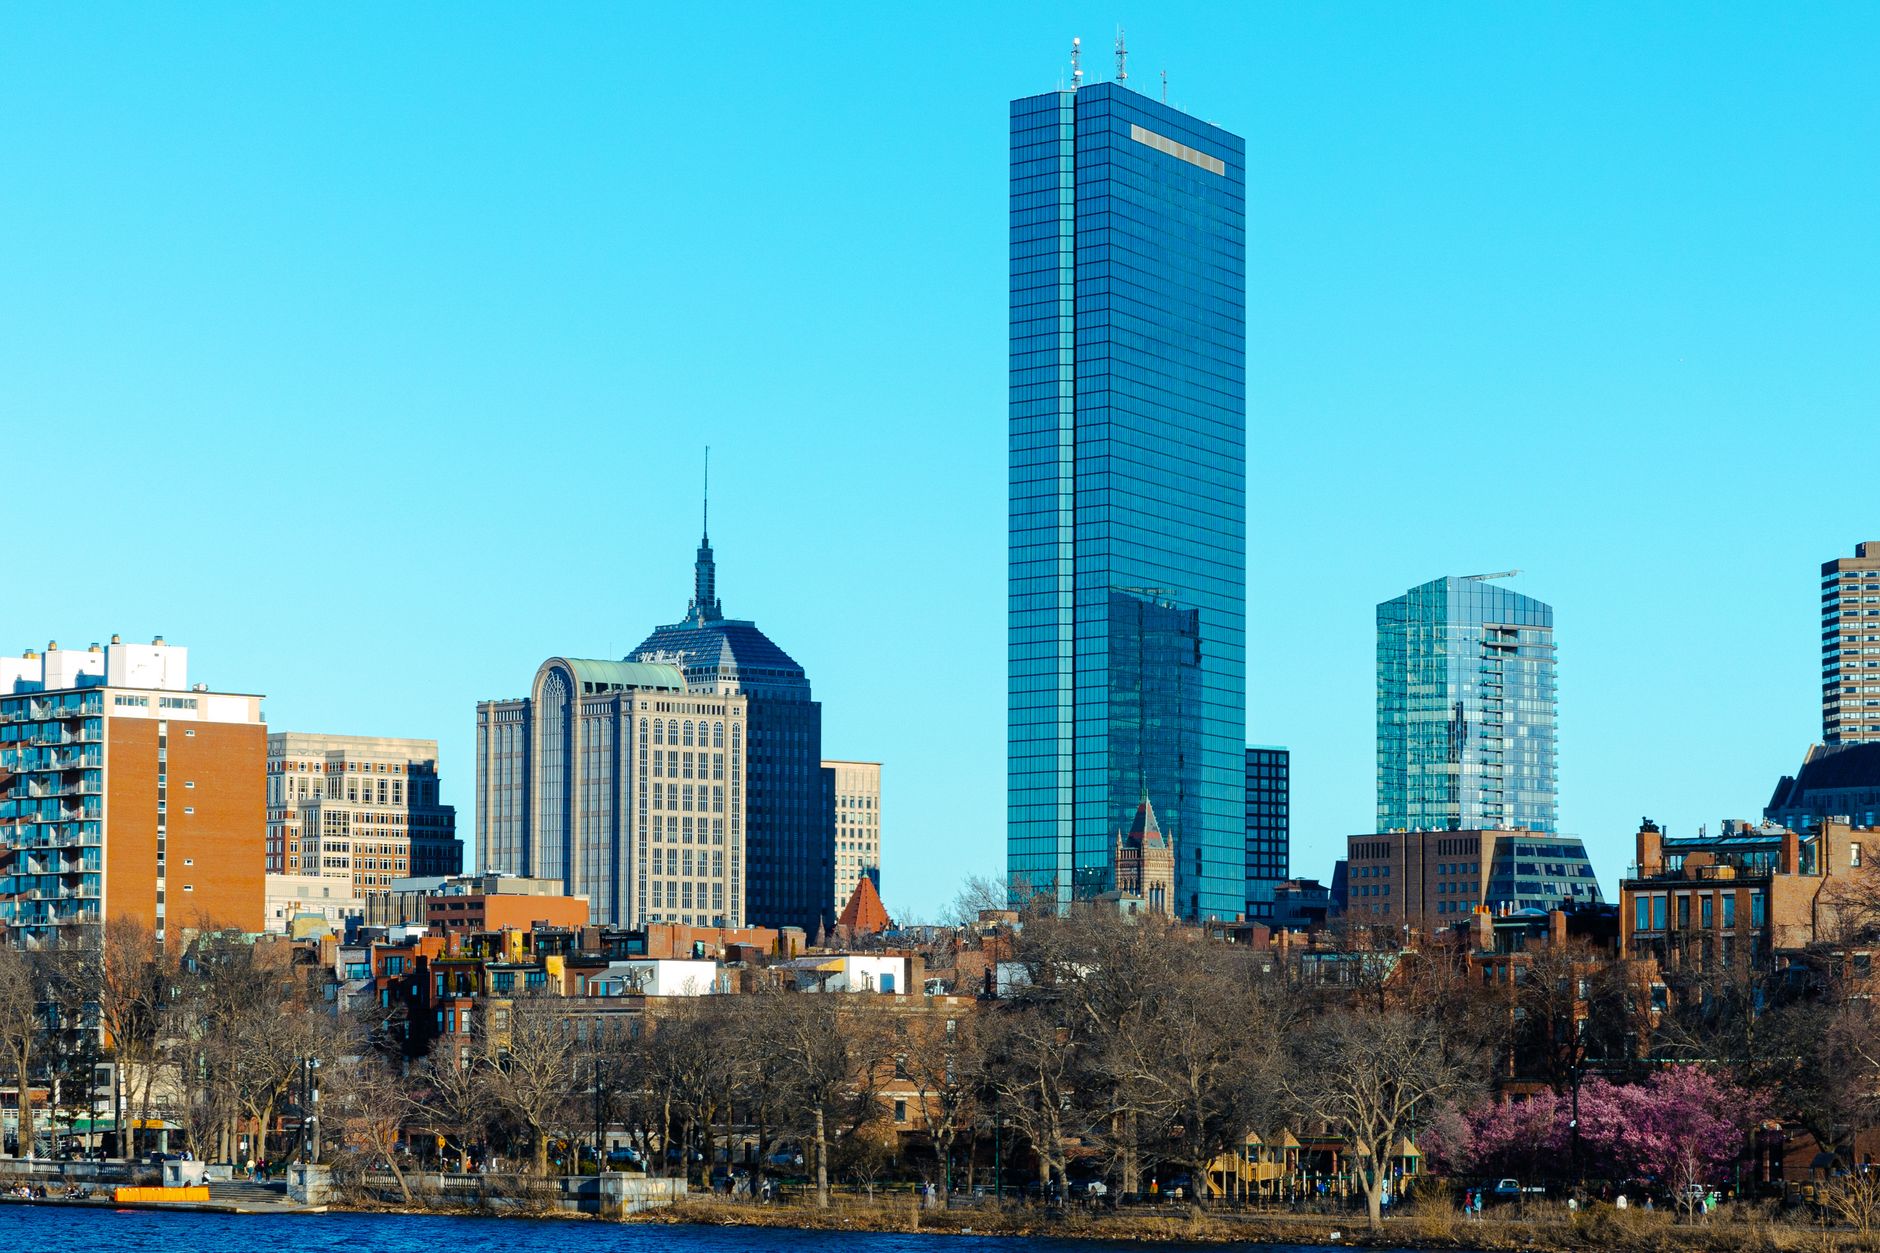
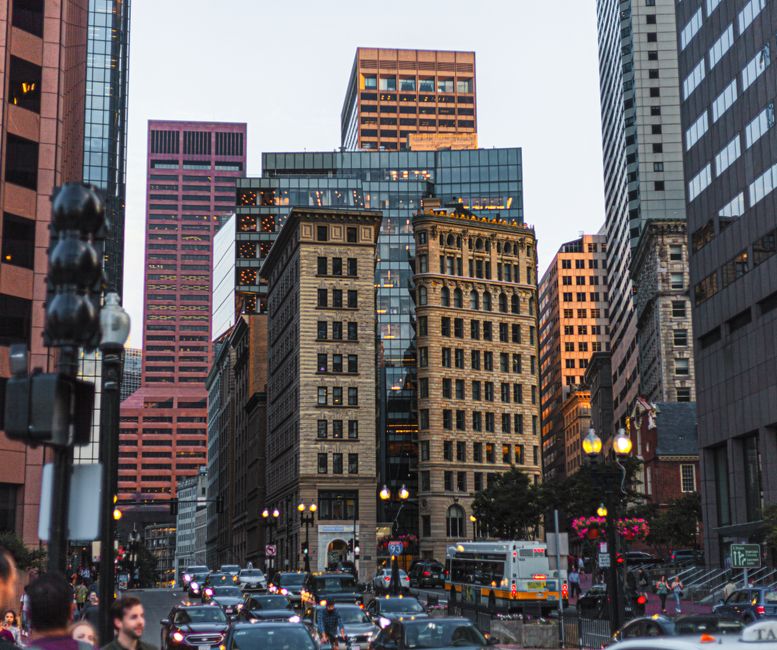
Violent crime in the city has decreased 3.2 percent compared to the same period last year, marking the second consecutive year of decline. However, property crimes have ticked upward by 5.7 percent, with break-ins in Back Bay and Beacon Hill accounting for nearly 340 reported incidents through June. Downtown Boston saw 847 motor vehicle thefts year-to-date, a 12 percent increase from 2025, with the Greenway parking facilities and municipal lots near the Financial District identified as hotspots.
Emergency response times have become increasingly strained. The Boston Fire Department reports average response times of 5 minutes 42 seconds for structure fires—above the city's 5-minute target. For non-emergency medical calls, paramedics now average 8 minutes 15 seconds, up from 7 minutes 50 seconds in 2025. On the busiest summer days, wait times in neighborhoods like Dorchester and Roxbury have occasionally exceeded 12 minutes.
The data illuminates stark disparities. The Seaport District and Back Bay neighborhoods collectively account for 31 percent of all police calls for service but represent only 8 percent of the city's population. Meanwhile, neighborhoods like Mattapan and Jamaica Plain, representing 12 percent of Boston's population, generate 18 percent of emergency calls, suggesting either higher incident rates or differential reporting patterns.
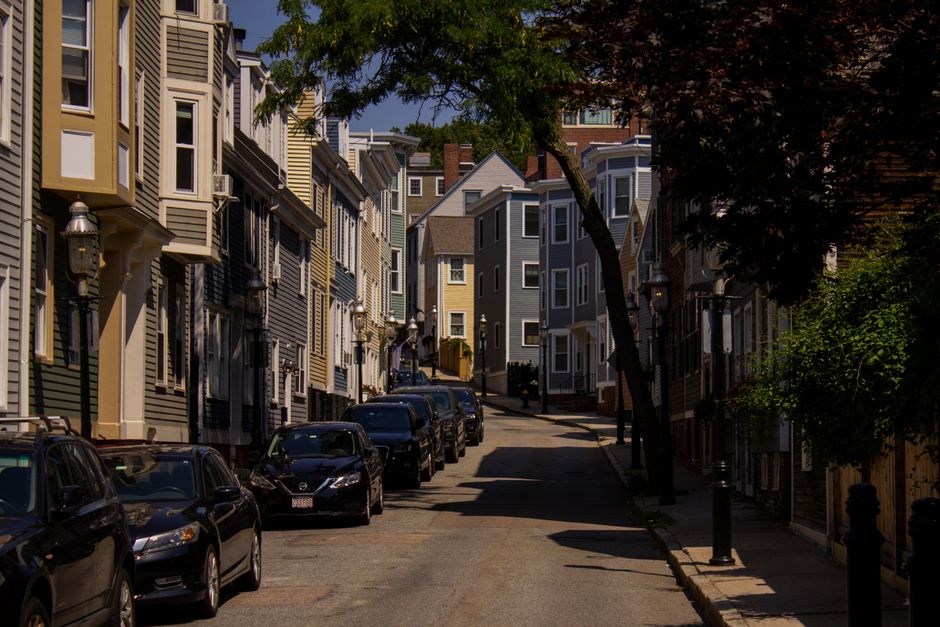
Community policing initiatives have shown measurable results in certain precincts. The Dorchester District's problem-solving unit, expanded in early 2025, correlates with a 9.4 percent reduction in street robberies through June—the most significant single-precinct improvement in the city.
Boston's 911 system processed 487,293 calls through June 29, representing a 2.1 percent increase from 2025. Non-emergency line utilization has grown 8.9 percent, suggesting residents increasingly understand the distinction, though staff shortages mean average hold times have risen to 3 minutes 18 seconds.
Budget allocation reveals priorities: emergency services have received $847.2 million of the city's $2.9 billion operating budget—29.2 percent, unchanged from 2025. Yet personnel costs consume 78 percent of that figure, leaving limited resources for technology upgrades or expanded coverage.
The data suggests Boston's safety profile is improving in specific areas while deteriorating in others, a nuanced reality that demands targeted responses rather than city-wide solutions.
This article was compiled by AI and screened before publishing. See our editorial standards.
How does this story make you feel?
Spread the word
About this article
Published by The Daily Boston
Daily brief
Free, in your inbox before 7am. Weekdays.
More in News