By The Numbers: Boston's Climate Goals Face a $47 Billion Reality Check
New analysis reveals the scale of investment needed to meet the city's 2050 net-zero commitments—and where the spending gaps threaten progress.
New analysis reveals the scale of investment needed to meet the city's 2050 net-zero commitments—and where the spending gaps threaten progress.
Boston's ambitious climate targets rest on a foundation of data that municipal planners are only now fully quantifying. A comprehensive audit released this month by the Boston Planning & Development Agency shows the city must invest $47 billion through 2050 to achieve net-zero emissions—a figure nearly triple earlier estimates and one that underscores the financial chasm between aspiration and infrastructure reality.
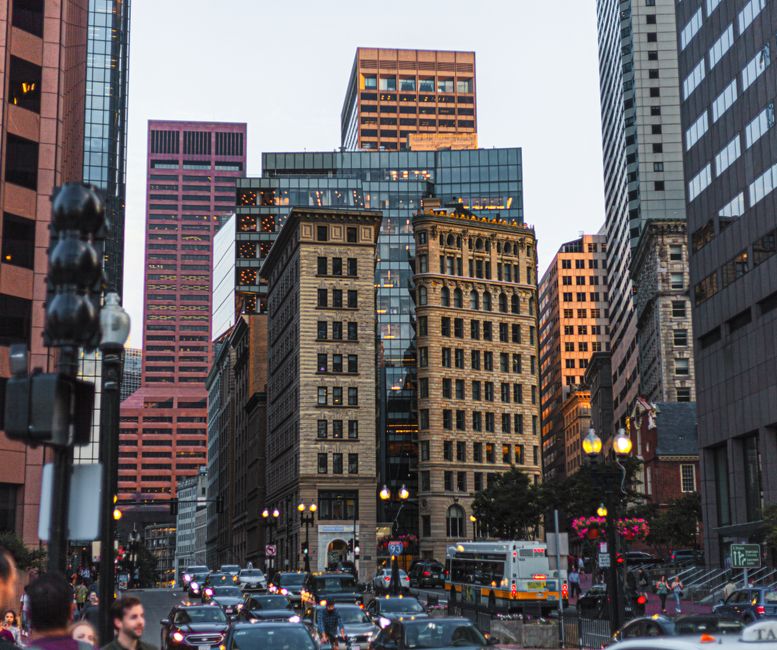
The numbers tell a sobering story. Buildings account for 73 percent of Boston's greenhouse gas emissions, according to the city's latest emissions inventory. The retrofit challenge is staggering: approximately 8,400 buildings citywide built before 1980 currently lack modern climate controls, consuming energy at rates 40 to 60 percent higher than comparable structures built to current standards. Upgrading these structures—concentrated in neighborhoods like Jamaica Plain, Dorchester, and Back Bay—would cost an estimated $31.2 billion alone.
Transportation presents a parallel crisis. The MBTA's aging fleet requires $18 billion in capital improvements over two decades to transition fully to electric buses and modernize rail infrastructure, according to the transit authority's own projections. Commuters using the Red Line from Ashmont to Charles/MGH stations alone generate approximately 142,000 vehicle-miles monthly through last-mile transfers. Reducing that figure by 35 percent—Boston's target—demands transit investments the city currently funds at barely 12 percent of required levels.
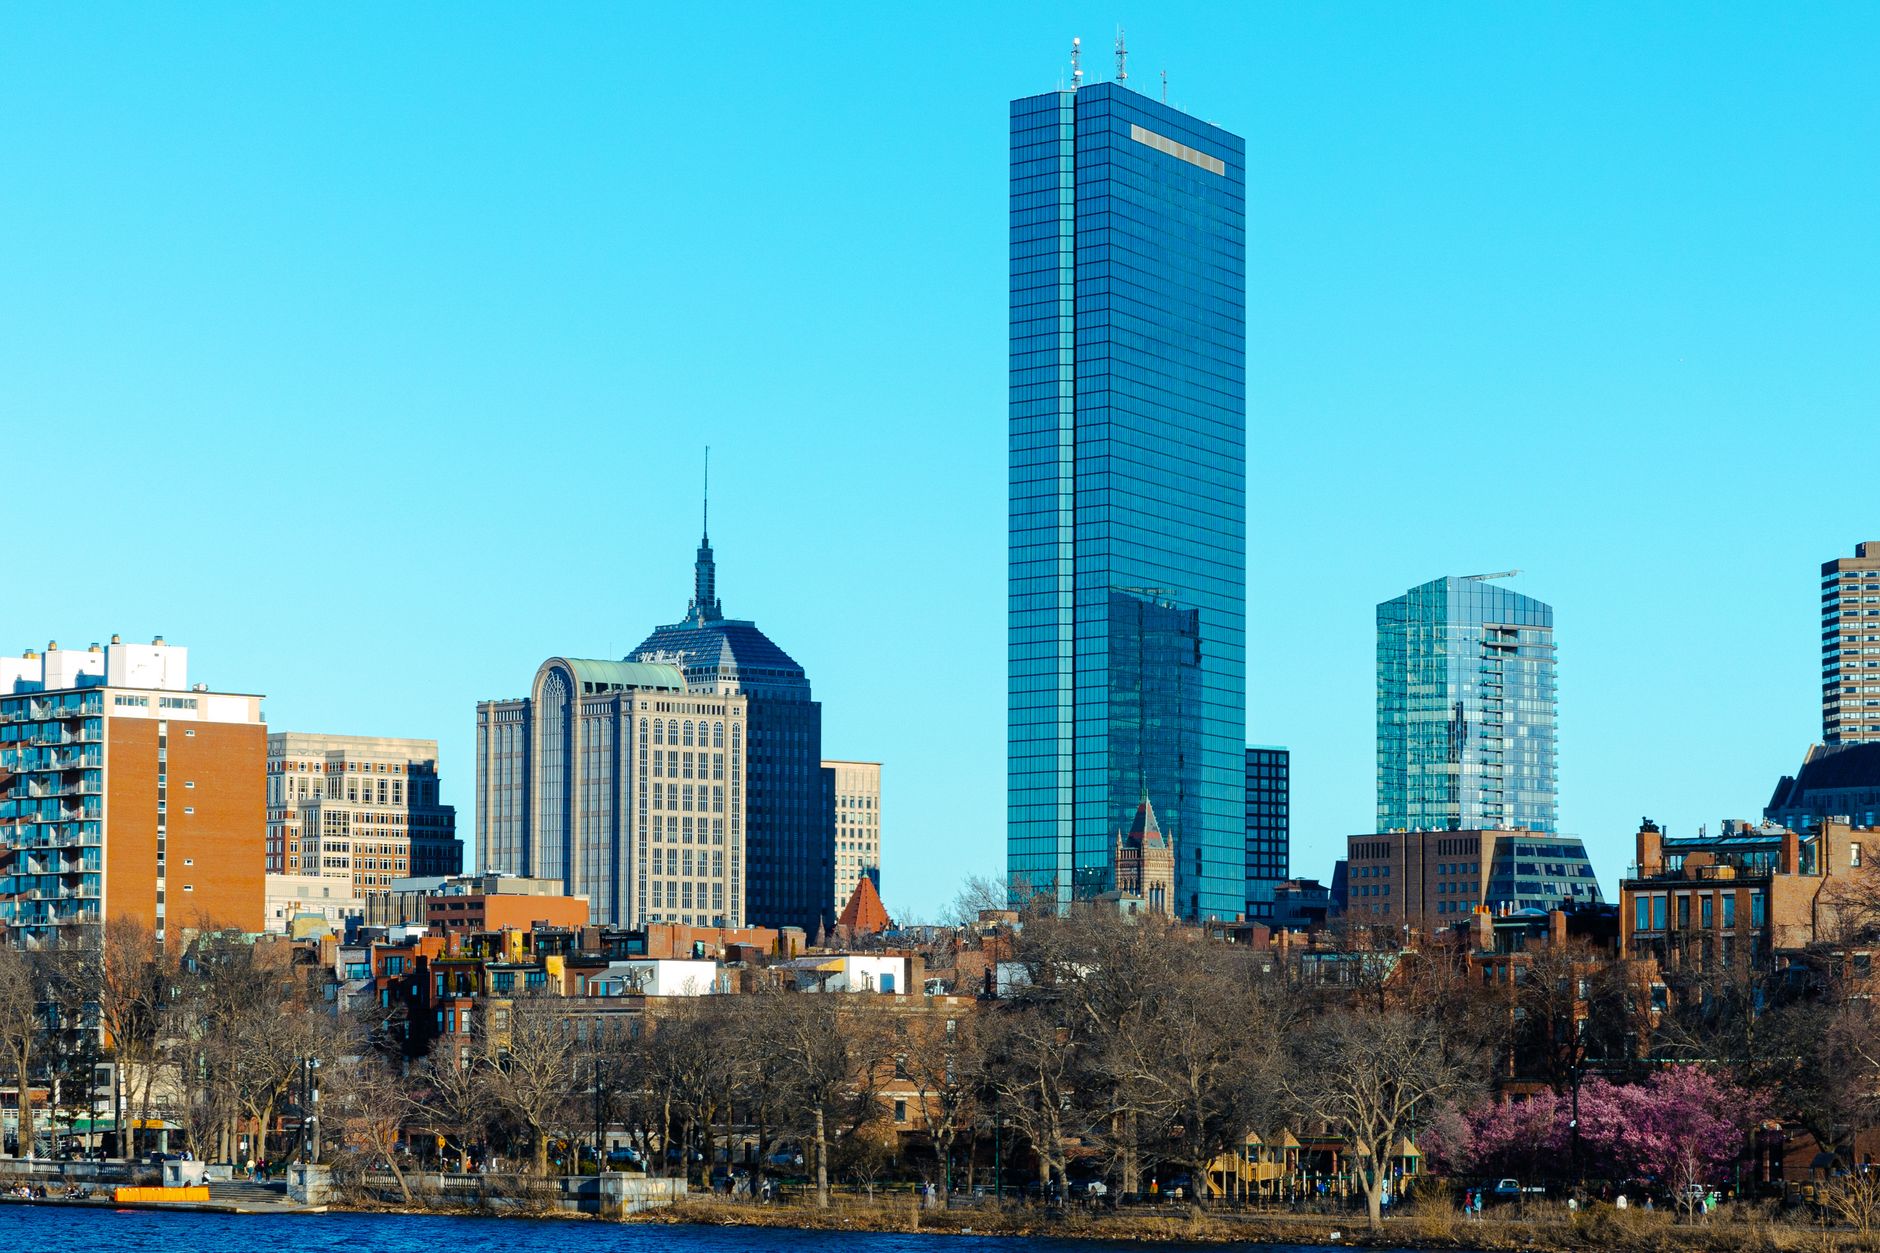
Where progress is measurable, the data reveals workable pathways forward. Boston's municipal buildings reduced energy consumption by 27 percent since 2005, avoiding $94 million in utility costs. The Emerald Necklace—the 1,100-acre park system spanning from Boston Common to Franklin Park—has sequestered an estimated 847,000 tons of carbon dioxide over fifteen years. Tree canopy coverage in neighborhoods like Roslindale and West Roxbury averages 31 percent, compared to 8 percent in industrial zones near the Seaport District.
Solar deployment offers the brightest metric. Rooftop photovoltaic installations across the city increased 340 percent from 2016 to 2024, generating 187 megawatts of peak capacity. That growth came despite installation costs remaining 22 percent above the national average due to roof complexity and historical preservation requirements in neighborhoods like Beacon Hill.
City officials caution that the $47 billion figure assumes federal and state funding covers 58 percent of costs—a dependency that leaves Boston vulnerable to political shifts in Washington. Without that support, local property taxes would need to rise approximately $180 annually per household citywide to bridge the gap. The data, then, doesn't merely document a problem. It quantifies the cost of delay.
This article was compiled by AI from the sources linked above and screened before publishing. See our editorial standards.
How does this story make you feel?
Spread the word
About this article
Published by The Daily Boston
Daily brief
Free, in your inbox before 7am. Weekdays.
More in News