By the Numbers: What Boston's Crime Data Reveals About Summer Safety Patterns
New analysis of emergency response records shows where the city's public safety challenges cluster, and what the statistics tell us about resource allocation.
New analysis of emergency response records shows where the city's public safety challenges cluster, and what the statistics tell us about resource allocation.
Boston's emergency services responded to 47,829 calls in the first five months of 2026—a 3.2 percent increase from the same period last year—according to newly released data from the Boston Police Department and Fire Department that offers a granular view of where public safety pressures are mounting as summer approaches.
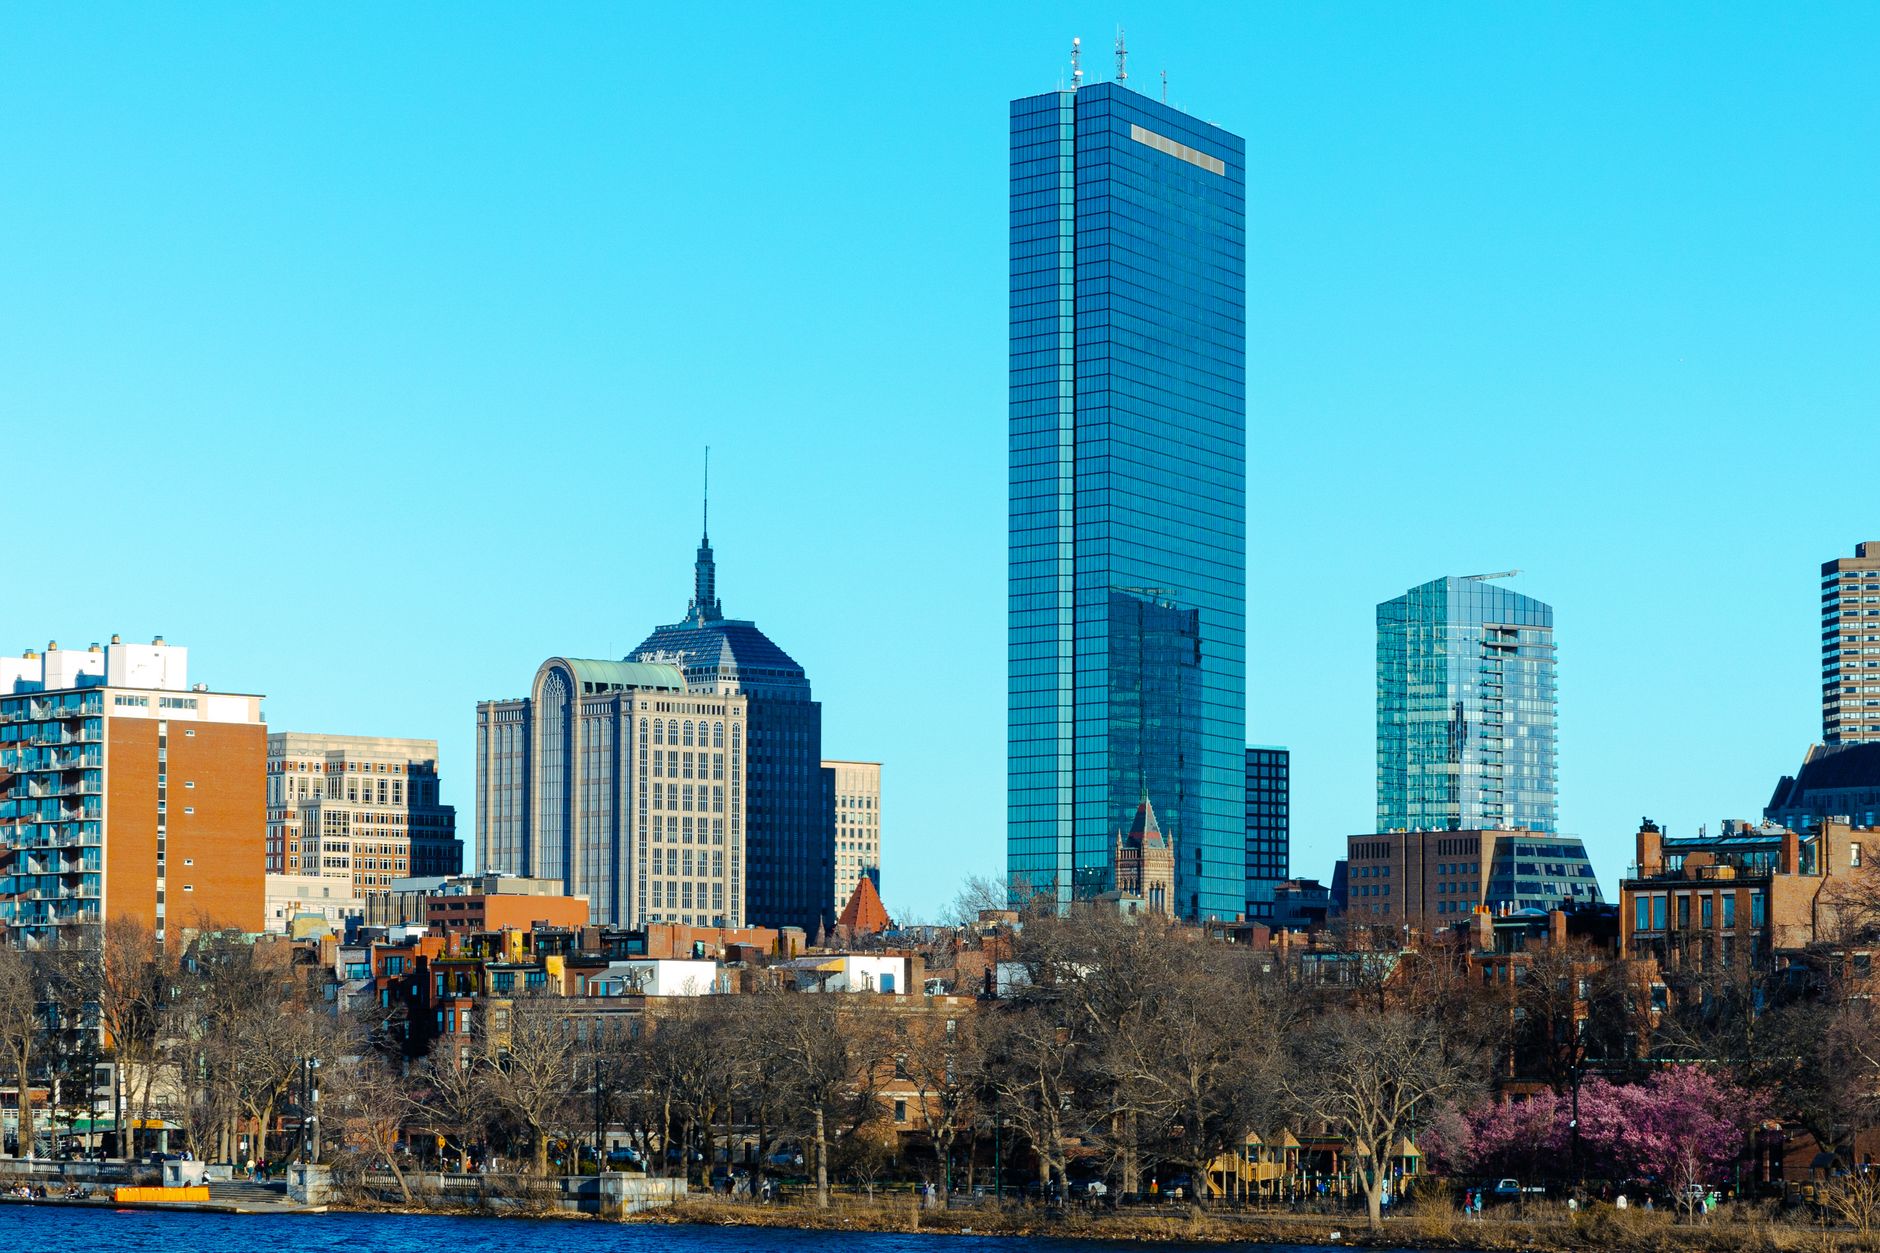
The statistics paint a complex picture of crime and emergency response across the city's neighborhoods. Roxbury and Dorchester together accounted for 18 percent of all violent crime incidents through May, despite representing roughly 14 percent of the city's population. Conversely, Back Bay and the Financial District reported only 2.1 percent of serious assaults, though they see significantly higher foot traffic, suggesting concentrated socioeconomic and neighborhood factors drive crime clustering.
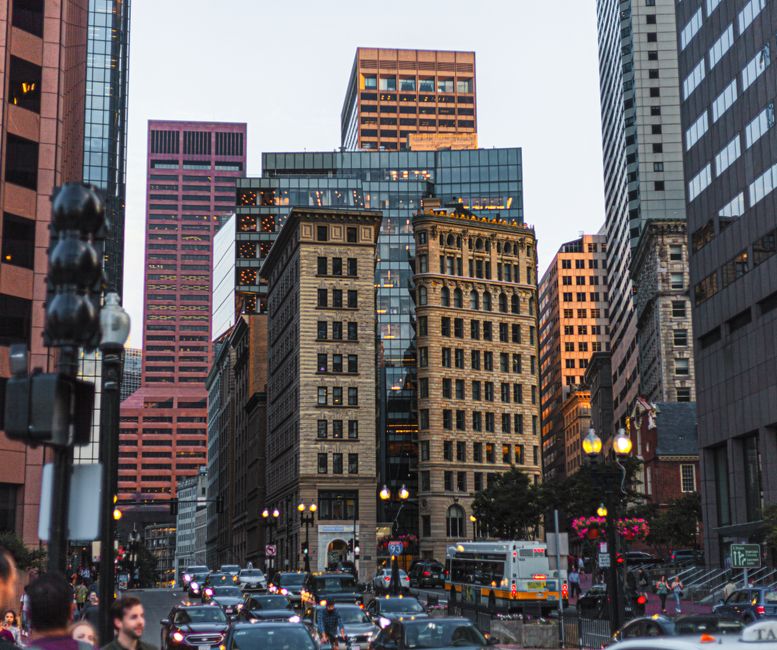
Response times tell another story. Average police response to priority-one calls in downtown Boston near the New England Medical Center sits at 4.2 minutes. In areas around Mattapan Square and Blue Hill Avenue, the same classification of emergency averages 7.8 minutes—a gap city officials attribute partly to geographic sprawl and traffic patterns on Route 28.
The data also highlights shifting crime patterns. Gun violence incidents dropped 12 percent year-over-year through May, but robberies increased 19 percent, with clusters near the Orange Line's Forest Hills and Community College stations. Transit-adjacent crime now represents 8 percent of all reportable incidents, up from 5.2 percent two years ago.
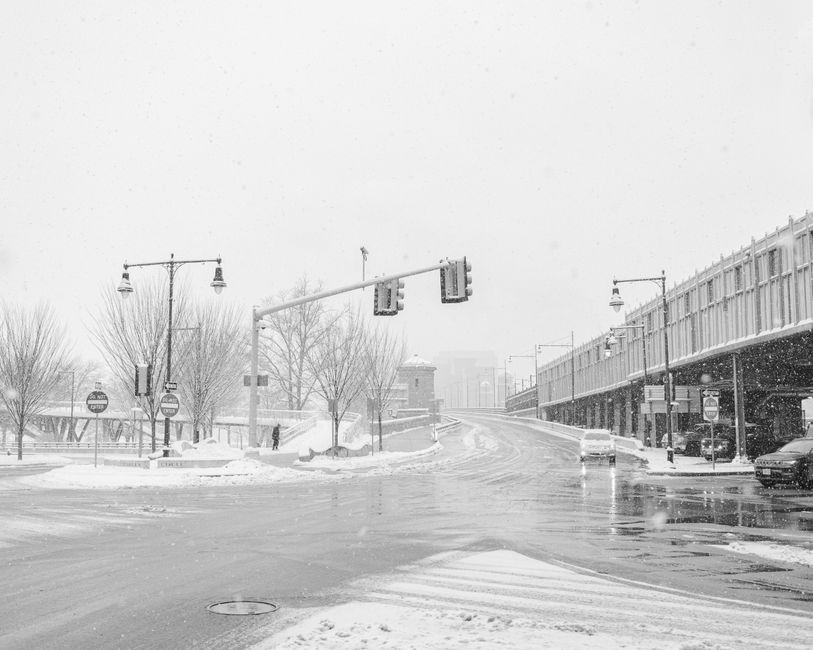
Summer months historically strain resources further. Last June, the BPD fielded an average of 523 calls daily—about 8 percent above the annual average. The Fire Department's non-emergency transport calls spike 11 percent during summer months, often related to heat-related illness and pedestrian accidents near major attractions like the Harborwalk and Boston Commons.
Budget allocations appear to reflect these patterns. The city's latest emergency services allocation directed 34 percent of patrol resources to neighborhoods representing 31 percent of reported crime, suggesting slight over-resourcing in some areas and under-resourcing in others. Community advocates have raised concerns about whether current distribution matches actual need.
Perhaps most revealing: the data shows 62 percent of property crimes go unsolved, while violent crime resolution rates stand at 41 percent. These figures remain consistent with five-year trends and suggest systemic challenges in investigation capacity rather than recent fluctuations.
As Boston heads into peak summer season, police commissioner officials emphasize that data-driven deployment strategies continue to inform shift scheduling and neighborhood patrols, though questions remain about whether current resource levels adequately serve the city's most vulnerable areas.
This article was compiled by AI and screened before publishing. See our editorial standards.
How does this story make you feel?
Spread the word
About this article
Published by The Daily Boston
Daily brief
Free, in your inbox before 7am. Weekdays.
More in News