By the Numbers: What Boston's Sustainability Push Really Looks Like
New data reveals the scale of the city's environmental goals—and how far it still has to go.
New data reveals the scale of the city's environmental goals—and how far it still has to go.
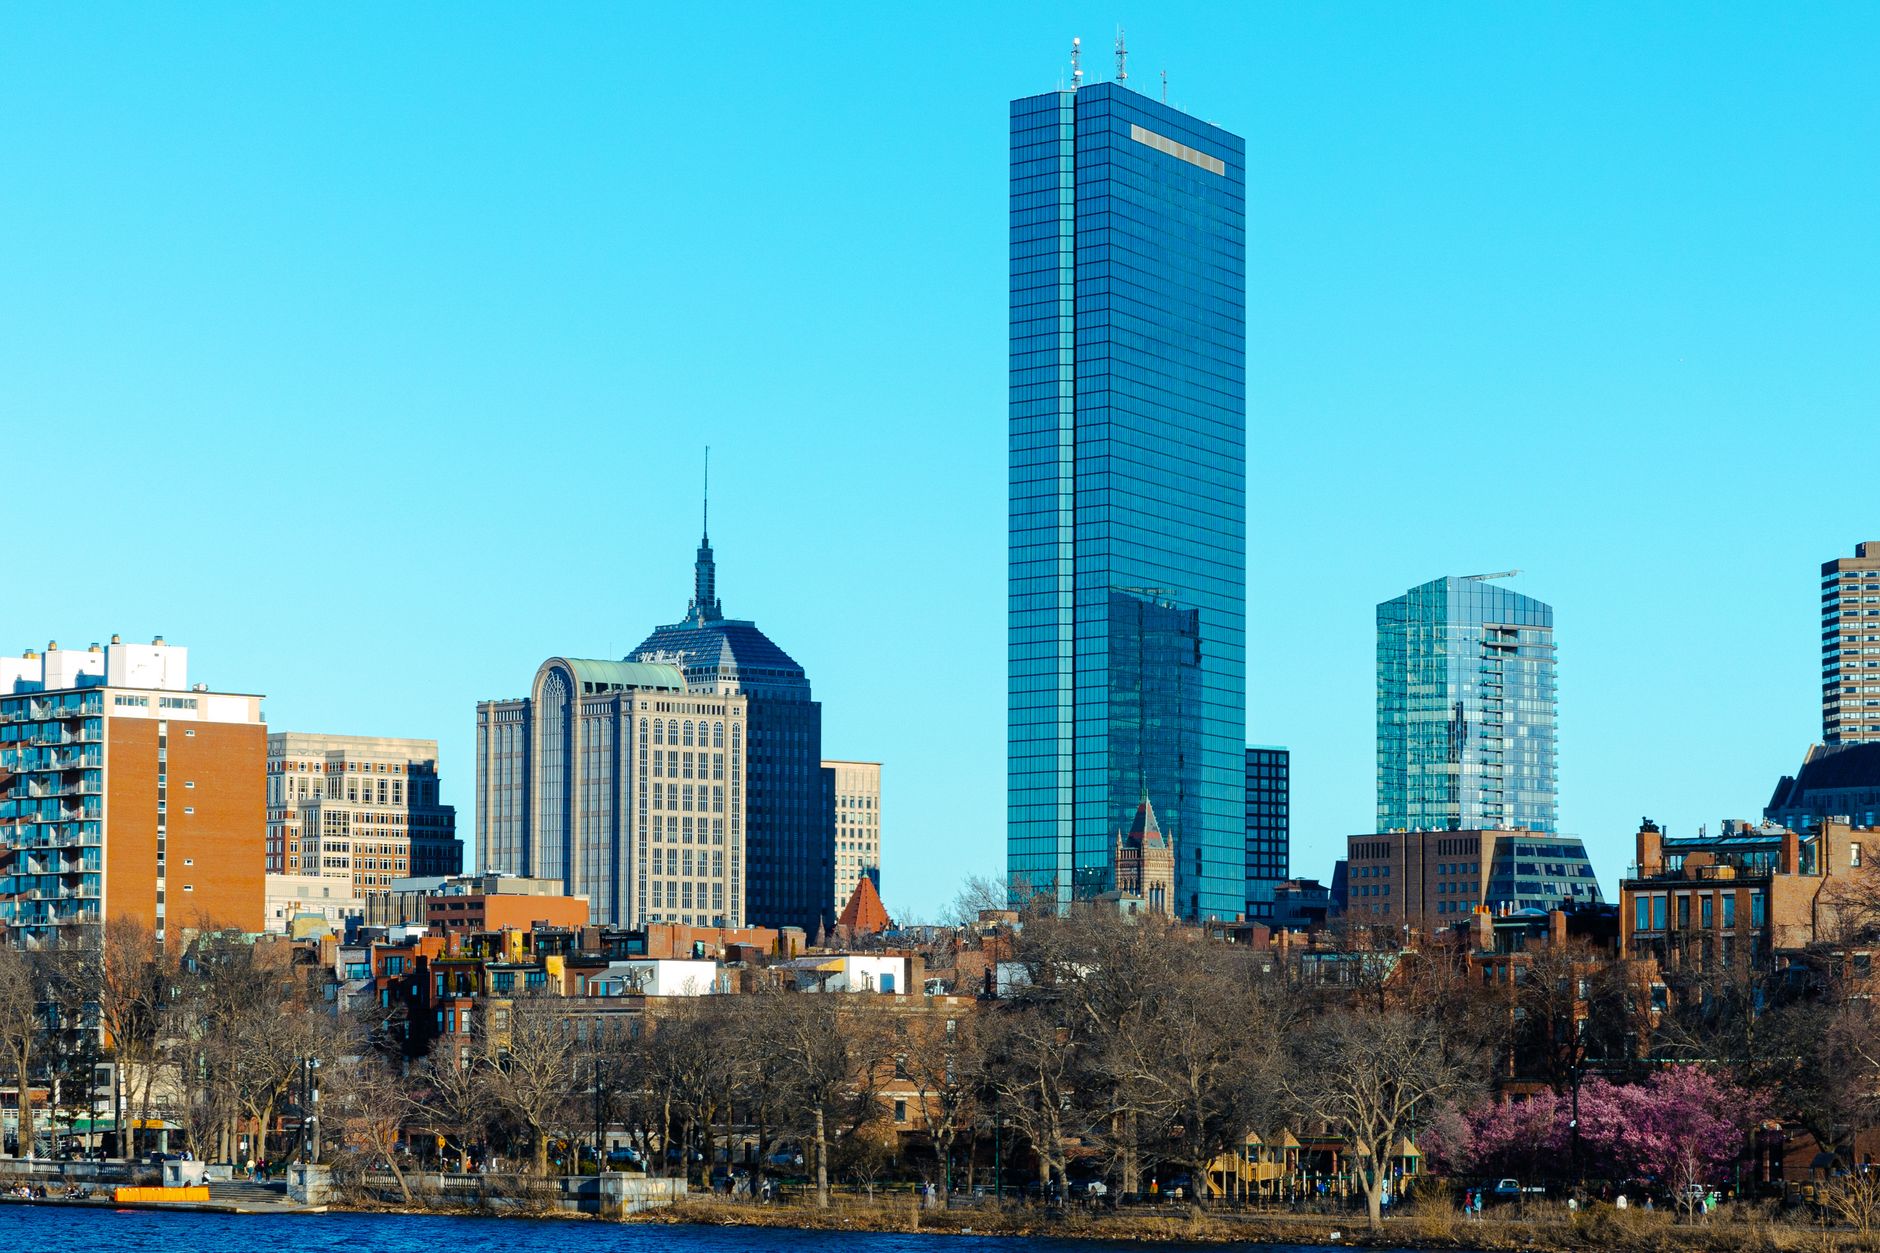
Boston's push toward carbon neutrality by 2050 sounds ambitious. But when you examine the actual figures driving the city's sustainability initiatives, the picture becomes more complicated—and more urgent.
According to the most recent municipal emissions inventory released this spring, Boston generated approximately 6.7 million metric tons of greenhouse gases in 2023, with buildings accounting for 60 percent of that total. That's down from 8.2 million metric tons in 2015, marking progress. But at the current rate of reduction, the city would need to accelerate its annual emissions cuts by roughly 2.5 times to meet its 2050 target.
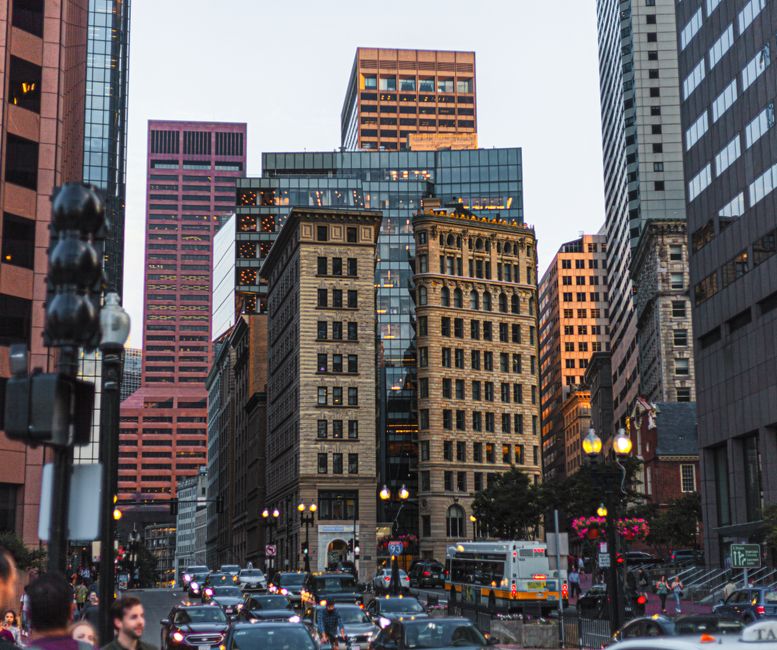
The numbers tell a story of selective progress. The Seaport District, once Boston's industrial waterfront, has emerged as a sustainability test case. Since 2010, the neighborhood has reduced per-capita energy consumption by 34 percent, according to data compiled by the Boston Planning and Development Agency. Yet similar reductions haven't materialized in Roxbury or Dorchester, where aging housing stock dominates. The average building age in Roxbury is 84 years; in the Seaport, it's 12 years.
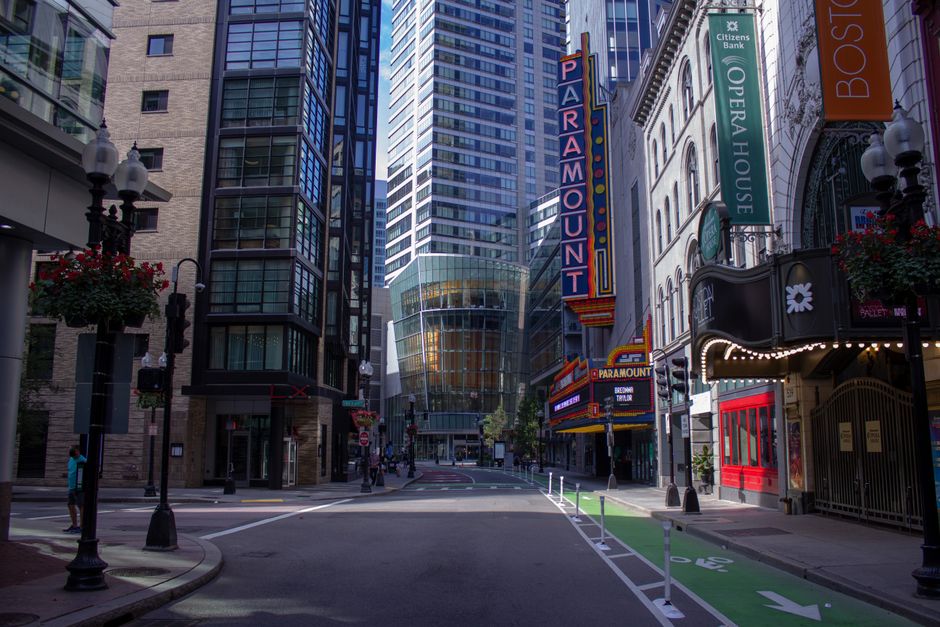
Transportation presents another gap. The MBTA's ridership hit 287 million trips in 2022—down 22 percent from pre-pandemic levels. While transit ridership has partially recovered this year, the data shows Bostonians increasingly rely on personal vehicles. Emissions from transportation now represent 27 percent of the city's total carbon footprint, up from 24 percent in 2015.
The renewable energy transition reveals similar disparities. Boston's municipal buildings have achieved 89 percent renewable energy usage, according to 2024 data. But residential renewable adoption stands at just 11 percent citywide, with costs remaining prohibitive. A typical rooftop solar installation runs $18,000 to $25,000 before incentives—pricing out much of the city's working-class neighborhoods.
Recent initiatives show promise through data-driven approaches. The city's tree-planting program, accelerated in 2021, has added 5,200 trees annually across Boston's neighborhoods. Tree canopy coverage has increased from 13.2 percent in 2014 to 15.8 percent today. Studies suggest this could reduce neighborhood temperatures by up to 3 degrees Fahrenheit during summer months.
The numbers, however, underscore a fundamental challenge: sustainability gains concentrate in wealthier, newer neighborhoods while older residential areas lag. Closing that equity gap—not just the emissions gap—may determine whether Boston's 2050 vision becomes reality or remains statistical aspiration.
This article was compiled by AI and screened before publishing. See our editorial standards.
How does this story make you feel?
Spread the word
About this article
Published by The Daily Boston
Daily brief
Free, in your inbox before 7am. Weekdays.
More in News