Boston's Office Puzzle: What Commercial Property Trends Tell Us About Economic Health
Rising vacancy rates and shifting investment patterns in the city's core markets reveal deeper truths about where capital is flowing—and where it's retreating.
Rising vacancy rates and shifting investment patterns in the city's core markets reveal deeper truths about where capital is flowing—and where it's retreating.
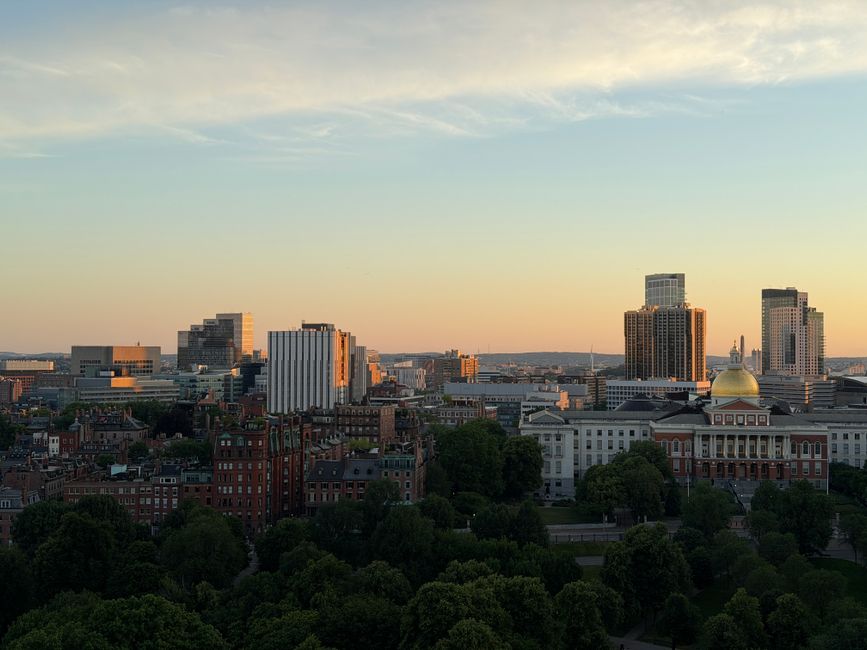
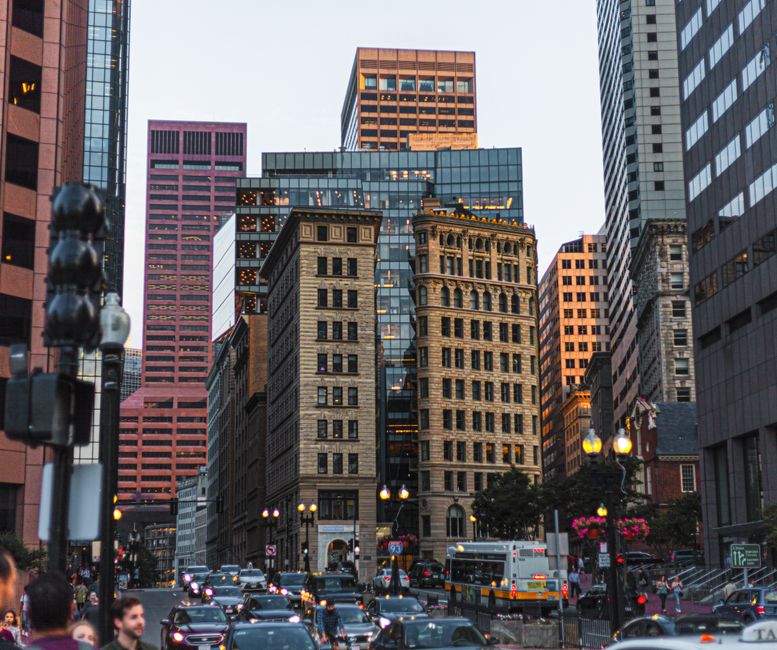
Boston's commercial real estate market is sending mixed signals that tell an important story about the broader economy. While headline figures show resilience, the granular data tells a more nuanced tale of structural shifts that both investors and policymakers need to understand.
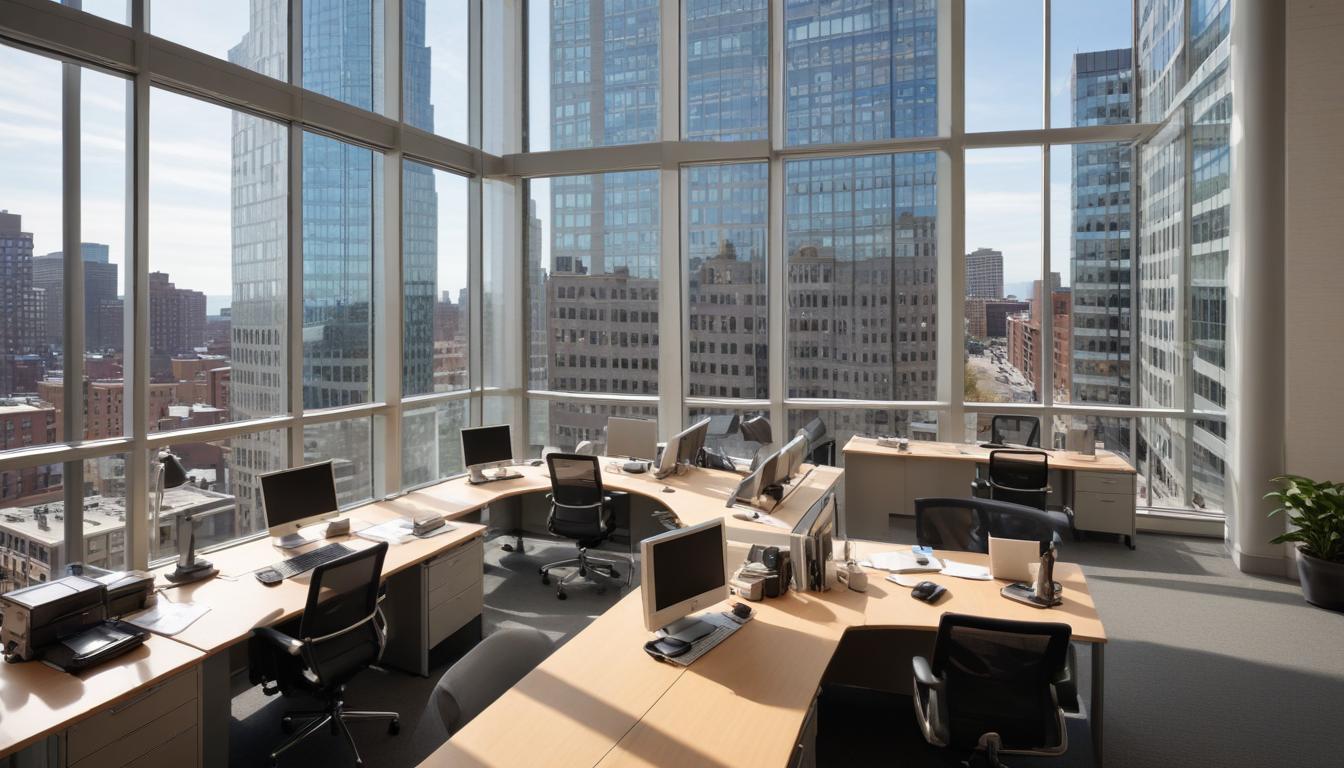
The numbers paint a picture of transition. Downtown Boston's office vacancy rate has hovered around 16-17% in recent months, compared to the pre-pandemic norm of roughly 8-10%. This matters because vacancy rates function as an economic barometer—they reflect corporate confidence, hiring plans, and whether businesses believe they need physical space. When vacancy rises sharply, it signals hesitation. When it stabilizes at elevated levels, it suggests a new equilibrium forming.
What's particularly revealing is where capital is actually flowing. Investment in life sciences and biotech office space in Kendall Square and the Seaport District remains robust, with transactions in these neighborhoods commanding premium prices above $50 per square foot annually. Meanwhile, traditional Class B office stock along Washington Street and in the Financial District is experiencing meaningful pressure, with landlords offering concessions—free months of rent, tenant improvement allowances—that were unthinkable five years ago.
This divergence points to a fundamental economic truth: not all office space is equal, and not all industries are equally bullish on physical proximity. The biotech sector's continued investment appetite reflects confidence in sectors tied to innovation and venture capital. The pressure on legacy office space reflects the durability of remote work adoption, particularly in industries where location matters less than connectivity.
Interest rates amplify these trends. Higher borrowing costs make financing commercial property acquisitions more expensive, which reduces competition for deals and compresses valuations. A property that might have traded for $400 million in 2021 might fetch $320 million today—not because the building is worse, but because the cost of capital has fundamentally changed the calculus of ownership.
For investors, this environment separates opportunity from risk. Properties in submarkets with strong tenant demand—particularly those housing professional services, technology, and healthcare tenants—remain attractive. Older office buildings in secondary locations increasingly face questions about long-term viability that can't be resolved by simple math.
Boston's commercial property market is ultimately telling us that the economic recovery is real but uneven, concentrated in specific sectors and geographies. Understanding these patterns—reading the vacancy maps and investment heat maps carefully—is essential for anyone trying to gauge where business confidence actually stands.
This article was compiled by AI from the sources linked above and screened before publishing. See our editorial standards.
How does this story make you feel?
Spread the word
About this article
Published by The Daily Boston
Daily brief
Free, in your inbox before 7am. Weekdays.
More in Business